NetMonster – The Cellular Network Analyzer That Helps You Fix Weak Signal

Why does your phone drop bars in the same spot every day? The answer lies in which cell tower you’re connected to, how strong that signal really is, and whether your carrier is properly handing off between towers. That’s where NetMonster (4.2 stars, 1.000.000+ downloads) comes in, this Android app gives you the tools to see exactly what your phone sees when it connects to cellular networks.
What Makes NetMonster Different?
While most network apps just show basic signal bars or run speed tests, NetMonster reveals:
-
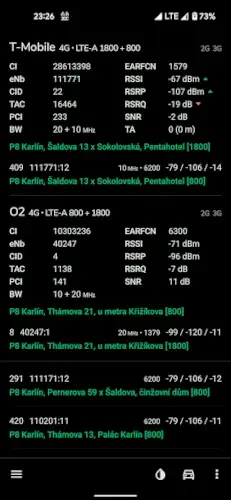
Live cell tower mapping (with distance and direction)
-
Signal quality metrics (RSRP, RSRQ, SINR – the numbers carriers use)
-
5G NSA vs. SA identification (is your “5G” just anchored to 4G?)
-
Carrier aggregation details (how many frequency bands your phone is using simultaneously)
The kicker? It works completely offline, no internet needed. This makes it perfect for diagnosing dead zones where you have no data connection.
NetMonster Features :
Tower Mapping You Can Fix Yourself
Ever opened a coverage map from your carrier that showed “excellent signal” where you actually get one bar? NetMonster lets you:
-
See exactly which tower you’re connected to
-
Correct locations when the database is wrong (crowdsourced improvements)
-
Filter by carrier to compare Verizon vs. T-Mobile towers in your area
Signal Graphs That Show Patterns
The app tracks your RSRP (signal strength) over time, so you can:
-
Prove to your carrier that your office has consistent weak signal
-
Find the best spot in your home for a Wi-Fi calling hotspot
-
Identify if interference happens at certain times (like rush hour congestion)
Beta Features for Power Users
Through the beta program, you can access:
-
Per-band CQI (Channel Quality Indicator) for advanced optimization
-
VoLTE/VoNR metrics to debug call quality issues
- Dual SIM metrics if you use two carriers
Real Problems It Solves
“Why Does My Kitchen Have No Service?”
NetMonster can show:
-
Your phone clinging to a distant tower instead of switching to a closer one
-
Weak high-band 5G that doesn’t penetrate walls well
-
Carrier aggregation failing to combine bands properly
“Is It Worth Switching Carriers?”
Before you port your number:
-
Compare how many towers each carrier has near your home/work
-
Check if they use low-band spectrum (better for rural areas)
-
See real world 5G availability, not just marketing claims
“Am I Really Getting 5G?”
Many “5G” connections are actually NSA (Non-Standalone), meaning they rely on 4G infrastructure. NetMonster clearly shows:
-
5G NSA (shows both 4G anchor and 5G bands)
-
True 5G SA (full independence from 4G)
What Users Say :
The Good:
-
“Finally understood why my LTE drops every day at 5PM, congestion on band 2.”
-
“Barely uses battery compared to similar apps.”
-
“Proved to my landlord we need a cell booster in our unit.”
The needs work part:
-
Some tower locations are slightly off (but you can fix them)
-
Free version shows ads (though they don’t interrupt use)
-
No iOS version (Android only)
For cellular analysis, alternatives like OpenSignal focus more on coverage maps than tower level details. NetMonster gives you the technical readouts carriers use internally.
How to Get the Most Out of NetMonster
Pro Tips for Power Users
Use Signal History to Demand Carrier Improvements
Carriers often dismiss complaints like “my signal is weak”. With NetMonster, you can:
-
Graph RSRP/RSRQ over days to prove consistent poor coverage
-
Note tower handoff failures (when your phone gets “stuck” on a distant tower)
-
Export this data as PDF or CSV to attach to support tickets
Example: A Reddit user got T-Mobile to install a new small cell after showing 3 months of <-120dBm RSRP in their neighborhood.
Export Logs for Deep Analysis
The CSV export includes:
-
Timestamps
-
Cell IDs
-
Frequency bands
-
Signal quality metrics
Tech savvy users parse this with:
-
Excel (pivot tables to find worst-performing towers)
-
Python (matplotlib to visualize coverage gaps)
-
Google Earth (plot towers with signal strength heatmaps)
Join the Beta for Cutting-Edge Features
Beta users get early access to:
-
VoLTE/VoNR metrics (debug call drops)
-
Per-band CQI (identify congested frequencies)
-
Dual-SIM analytics (compare two carriers on one device)
How to join: Tap Settings → About → Join Beta in the app.
Limitations to Know
-
Android-only: No iOS version planned (Apple restricts cell tower APIs)
-
Location permissions required: For mapping towers accurately
-
Ads in free version: Removable via one time $5 premium upgrade

When to Try Alternatives
Opensignal
-
Best for: Coverage maps based on crowd-sourced data
-
NetMonster wins on: Actual tower IDs and signal metrics
WiFiman
-
Best for: Wi-Fi channel analysis and router diagnostics
-
NetMonster wins on: Cellular network transparency
-
Use case: Use both, WiFiman for home, NetMonster for mobile
Speedtest by Ookla
-
Best for: Quick speed tests
-
NetMonster wins on: Explaining why speeds fluctuate
-
Key difference: Ookla shows symptoms, NetMonster reveals causes
Conclusion :
You’ll Love NetMonster If You:
-
Get frustrated by unexplained signal drops
-
Want to prove to your carrier where coverage fails
-
Are evaluating a carrier switch and want real tower data
-
Enjoy geeking out on network tech
Try an Alternative If You:
-
Only care about download speeds (use Ookla)
-
Need Wi-Fi diagnostics (WiFiman is better)
-
Use iPhone (Apple blocks this level of network access)
Ready to see what your phone knows but won’t tell you?
FAQ Questions for NetMonster
How accurate is NetMonster’s cell tower location data?
The app combines crowd-sourced data with your phone’s GPS. You can manually correct tower positions via Settings → Edit Cells. For official tower locations, cross-check with the FCC Antenna Registry (US) or national regulator databases.
Can I use NetMonster to compare carriers in my area?
Yes. Filter by operator (like T-Mobile vs. Verizon) to see:
-
Which has more towers near you
-
Their signal strength (RSRP) and quality (RSRQ)
-
Carrier aggregation configurations
Download NetMonster from Google Play Store to test it.
How to use NetMonster CSV logs for cell analysis?
Export logs (Menu → Export Data), then:
-
Visualize coverage gaps in Excel (sort by worst RSRP)
-
Map towers in Google Earth using lat/long coordinates
-
Identify congestion patterns with Python Pandas
For advanced help, email the developer: hello[at]netmonster.app
Does NetMonster work on 5G networks?
Yes. It shows:
-
5G NSA (Non-Standalone, anchored to 4G)
-
5G SA (True standalone 5G)
-
mmWave and C-band frequencies (where supported)
See the NetMonster Wiki for tech details.
Why does NetMonster need location permissions?
To map towers relative to your position. The app doesn’t upload your location, data stays local unless you choose to share it.